This guest post from project member Georgiann Gibson is a wonderful example of how the right use of the right tools can help DNA to break through your O'Malley Brick Wall and identify an extra generation of ancestors. Georgiann takes us through the various methods she used to try to tackle her genealogical conundrum, and finally, with a lot of tenacity, all her hard work paid off. Enjoy!
Update (Sep 18th): some additional commentary is included at the end of the article based on feedback from various discussions on Facebook. This comes after the photos at the end, and addresses some of the more technical aspects of the article.
Standby for another major update coming soon!! (Oct 4th)
 |
| My Dad, Charles Cheatle, and his plane (c. 1944) |
With that as a backdrop, my Irish genealogy success journey began with a handwritten list of O’Malley names and birthdates found in a family “Bible,” my mother’s autosomal DNA test results, and a list of DNA matches on ancestry.com.
 |
| The O'Malley Family Bible |
I had recently read Blaine Bettinger’s book “The Family Tree Guide to DNA Testing and Genetic Genealogy”. Other than that basic information, I had very little knowledge about what to do with all of the DNA information at my disposal, so I set a goal to learn how to use DNA to solve my seemingly unsolvable puzzle: finding parents for my mother Mary’s paternal grandfather, Edward O’Malley, a native of Ireland who emigrated to the U.S. in 1896 at age 77.
My first step was to sign up for a Roots Tech Conference that offered a strand focusing on DNA. It was through these presentations that I gained a better understanding of DNA in general and Y-DNA specifically (which traces back along the father, father, father line). However, it was primarily due to Dr. Maurice Gleeson’s presentation at that conference that I became enthused about trying to find a way to use Y-DNA to solve my Irish puzzle. After finishing the conference, I contacted a male cousin (TMO) and asked him to take a Y-DNA test. Because he wasn’t interested in genealogy, I offered to pay for his Y-DNA test and use my email so I could manage the process. Luckily, he agreed, and we ordered a Y-DNA test from Family Tree DNA (FTDNA). The wheels were now set in motion.
While waiting for the results of the Y-DNA test, I started looking through the list of people who had DNA relationships with my mother on Ancestry.com. Since she obviously had more O’Malley DNA than me, it was easier to find stronger DNA relationships. While I could identify most of the closely related people, there were others who seemed to have reasonably strong relationships but who were unknown to me. One person, JR, shared 179 centimorgans (cM’s) of DNA with my mother. There were a lot of O’Malley’s in his family tree and the tree was well-documented. His great-grandfather, John O’Malley (b. 1825), was born within a few years of my great-grandfather, Edward (b. 1819), and in a town within a few miles of where my great-grandfather is thought to have been born. Both of these men were also known to be stone masons. It seemed plausible that John O’Malley could be a brother of my great-grandfather Edward. When I contacted JR, he referred me to his cousin Christine L, who was their family genealogist and historian.
Before contacting her, I used DNA Painter’s Shared CM Tool to look for possible relationships between JR and Mary. The tool indicates that sharing 179 cM with someone is associated with a 51% probability for a relationship of either 2C1R, 1C3R, Half 2C or Half 1C2R. Using their chart to develop a visual representation, I placed text boxes with the names of the people from each of our trees into what seemed to be the most logical relationship based on age and birth year (see below). I then sent it to Christine to get her thoughts.
 |
| Using the Shared cM Chart to help visualise my mum's connection to JR |
Christine is a genealogy enthusiast and had herself been looking for potential parents and siblings for John O’Malley. She not only agreed with my speculation about the relationship, but helped find one of her male cousins (TLO) who agreed to take a Y-DNA test. My hopes were high that Y-DNA would help us find a conclusive answer.
In the meantime, both men, joined FTDNA’s O’Malley Project. As you know, Dr. Maurice Gleeson is the O’Malley Project Administrator. Once both tests were analyzed, Maurice explained to us that based on the Y-DNA testing comparison, the two men were 4 genetic steps apart at the 111-marker level. Because there is a very large margin of error associated with estimating the Time to a Most Recent Common Ancestor (TMRCA), Maurice's crude estimate indicated that the two men could have shared a common ancestor any time between roughly 1570 and 1870 or so. This news was a big disappointment because we were expecting to hear that there were 0 steps between the two men. So after several weeks of waiting, all we knew was that these two men were related, but not how. We had no confirmation that Edward and John were brothers. At that point, our hypothesis was still just a hypothesis. Would we have to wait for more O’Malley men to take a Y-DNA test? Was this a dead end? Another brick wall?
Not to worry. Maurice had another strategy. He said that to determine if Edward and John are brothers it will require autosomal DNA work. Our next steps would be: using Ancestry’s Shared Matches, find people who Mary and JR both share in common and note how many cM’s of DNA they share with Mary. After that, comb through their family trees in search of an O’Malley connection and make a colorized chart that incorporates each person’s O’Malley pedigree and amount of DNA shared. You can see the colorized DNA Relationship chart below. Each row forms a line of descent from the presumed MRCA (Most Recent Common Ancestor); the amounts of shared DNA (last cell in each row) are in relation to my mother, Mary. Each family is represented by a different color; colors change slightly as they descend through the generations and also change when there is more than one sibling in the line.
Through this process I found another family (with 3 branches) who shared DNA relationships with Mary. The parents of this family were Thomas Mealy (born c.1780) and Mary Murphy. And the 3 branches were headed by their 3 children: Jane (born 1811), Michael (1812), and Bridget (1817).
I now have people from four different branches (most from Australia, some from England) all related to my mom. The 5 lines can be summarized as follows:
Line 1 … Edward 1819 (my mom’s line, with 4 autosomal test-takers)
Line 2 … John 1825 (with 5 autosomal test-takers)
Line 3 … Jane 1811 (with 1 autosomal test-taker)
Line 4 … Michael 1812 (with 3 autosomal test-takers)
Line 5 … Bridget 1817 (with 0 autosomal test-taker)
All these “heads of family” were born within 14 years of each other and could all be potential siblings.
As you can see in the table, there is at least one person in three of the branches that shares a fairly strong amount of DNA with Mary. All of the matches in the table trace back to three potential brothers and one of the two sisters (the second sister, Bridget, has no living descendants that have done an autosomal DNA test as yet); my presumption is still that they are all siblings.
Of course, as prescribed by traditional genealogy, I made a general review of each tree for documentation. There is strong evidence that the parents of Jane 1811, Michael 1812 and Bridget 1817 are Thomas Mealy (born c.1780) and Mary Murphy. At the end of this article, I’ve included a copy of an Australian immigration document and photos of John O’Malley’s home near Tulla, Ireland (then and now) as examples of the quality of the documentation.
 |
| Colorized Relationship Chart showing test-takers, amount of DNA shared, and their lines of descent |
It just so happened that my family’s autosomal DNA had previously been uploaded to a site called GEDmatch, so I decided to see if anyone else from the colorized chart might have their DNA uploaded to that site. As luck would have it, I found that people who descended from four of the five potential siblings had autosomal DNA Kits on the website. Using the One-To-Many tool I found 6 matching people. After finding their Kit Numbers, I used a Chromosome Segment Mapping tool to find out if any of them had overlapping DNA segments with Mary. The chart below depicts 22 of Mary’s chromosomes and shows where each of her 6 matches' chromosome segments overlap with hers.
 |
| Overlapping segments on Chromosome 7 |
A general guideline for comparing overlapping chromosome segments is that they should be greater than 10 cM’s. Mary (Line 1), JR (Line 2) and FT (Line 4) had the most significant overlaps with one another on chromosomes 7, 10 and 16. On all three chromosomes, across all three comparisons (Mary and JR; Mary and FT; and JR and FT) the shortest overlap length was 15.9 cM's between JR and FT on chromosome 10 and the longest was 59.8 cM's between Mary and JR on chromosome 16; others fell in between.
From the chart, it is clear that members of Line 2 and Line 4 share common DNA segments with Mary on Chromsomes 7, 10 and 16, and are thus likely to all share the same common ancestor. Line 1 and Line 2 share an overlapping segment on Chromosome 7, indicating that they share a common ancestor with Mary. However, Line 3 does not share an overlapping segment with the other Lines. Nevertheless, these overlapping segments suggest that at least Lines 1, 2 and 4 share the same common ancestor. However, the question remains, which one? It looks like it could be Line 4’s MDKA Thomas Mealy born c.1780, but is there any other way of gathering further supportive evidence?
Once again, Maurice had a strategy to evaluate whether these five O’Malley’s were siblings or cousins. He suggested using DNA Painter’s What Are The Odds (WATO) tool to explore several alternative scenarios, but in a kind of "reverse way" to how WATO is usually used. To begin that process I need to know how many cM’s of DNA each of Mary’s matches shares with her and also with each other. By using available matching kits, GEDmatch created the Autosomal Matrix Comparison chart below with the shared DNA amounts for each person.
 |
| Shared DNA Matrix generated by GEDmatch |
 |
| Shared DNA Matrix incorporating data from GEDmatch and Ancestry (the latter obtained by writing to individual matches) |
A. Jane, Michael, Bridget, Edward and John are siblings.For each of these scenarios a WATO tree was built based on the pedigree shown in the Colorized Relationship Chart discussed previously. DNA quantities taken from the Shared DNA Matrix were entered, along with names and birth years. I only used the recommended DNA amounts of 40 cM’s or greater, so you will see that PO, for example, did not have enough shared DNA to evaluate.
B. Edward and John are 1st cousins to the rest.
C. Edward is a 1st cousin and the others are siblings.
D. John is a 1st cousin and the rest are siblings.
The first step was to run analyses for all four of the above scenarios using Mary as the “main comparator”. The WATO analyses for both Scenario C and D resulted in a 0% probability score, so we could see straight away that those scenarios were genetically impossible. With those relationships ruled out, it now appears that Jane, Michael, Bridget, Edward and John will either be siblings (Scenario A), or Edward and John will be first cousins to Jane, Michael and Bridget (Scenario B). Let’s look more closely at Mary’s results for Scenarios A and B, because the results for those two scenarios were not as straightforward as the results we found for Scenarios C and D.
The first set of screenshots below reveal Mary’s WATO results for the “Sibling” scenario (A). Screenshot 1 shows the tree I built to reflect that Jane, Michael, Bridget, Edward and John were siblings and Thomas Mealy, their father. I created a mirror position in the tree for Mary, shown as Hypothesis 4, so that her actual pedigree position would be visible. The tan rectangles in the tree reflect the amount of cM’s each person shares with Mary. In each WATO tree, potential hypothetical relationships are shown in blue shades, with an associated probability score for that relationship shown in either green (possible) or red (impossible). Note that we already know that Mary sits at the Hypothesis 4 position - the other (impossible) “hypotheses” are merely included to generate comparative probability scores as a "sense-check". Remember, we were using WATO in a "reverse way" and so really only one hypothesis was necessary per analysis (i.e. Hypothesis 4) and the outcome we were looking for was either "possible" or "not possible".
 |
| Screenshot 1: WATO Chart for Scenario A (all are siblings) |
 |
| Screenshot 2: WATO Table for Scenario A - Hypothesis 4 is not ruled out so Scenario A is possible |
 | |
|
 | |
|
However, there is hope. We have one more chance to shed some light on a possible resolution. We can rerun WATO comparisons of Scenarios A and B for Mary’s 6 other DNA matches to see if one or more of the other matches’ results can rule out either Scenario A or B.
In the table below, you will find a summary comparing all of those WATO comparisons. The participants, Mary, LL, JR, FT, PH, CL and AM, are listed down the left side of the chart. For each person there are three horizontal rows; one indicating the predicted relationship, another the probability of that relationship (extracted from the WATO output) and finally, the number of cM’s shared. Across the top of the chart, each person is listed again with columns that correspond to their results for Scenarios A and B.
 | |
|
Finally, when we look collectively at all of the individual pieces of documentation that we have accumulated through this process, there seems to be very convincing evidence that the “Sibling” hypothesis is the most likely scenario for Edward, John, Jane, Michael and Bridget!
Prior to having any knowledge of this type of analysis, I would have been happy to accept the fact that my initial hypothesis was correct because it was logical. Both Edward and John O’Malley shared closely related birth towns, ages and professions. Mary and JR fit neatly into the Shared cM chart and JR’s family had a great deal of solid documentation. I probably would not have even thought about alternative relationships for them.
Without finding birth records for Edward verifying parentage, will I ever know for certain? Perhaps not. But for now, with Maurice’s help, and the magic of DNA, I believe I have done a thorough analysis and that my sibling hypothesis has been proven "beyond reasonable doubt".
Documents & Photos
 |
| Michael Mealy’s Australian immigration record noting his parents, Thomas Mealy and Mary Murphy. Similar records were found for Jane and Bridget and their husbands. All immigrated at the same time. |
 |
| Photo of a home of John O’Malley (b.1825) in Ashler, a suburb of Tulla, Ireland (Date unknown). Interestingly, the small outbuilding to the right of the house is reported to have been host to clandestine meetings. Photo and story courtesy of TLO. |
 |
| Photo of the same house today as seen on Google Earth. Courtesy of TLO. |
 |
| Mary O’Malley (c. 1945) |
 |
| Francis Thomas Colton O’Malley (c. 1932) |
- O’Malley Project https://omalleydnaproject.blogspot.com/p/post-your-pedigree.html
- YouTube: https://www.youtube.com/c/DNAandFamilyTreeResearch/featured
- Five Strategies for Getting your Irish Ancestral Lines Back into the 1700’s: Celtic Connections Conference 2022
Family Tree DNA: BigY-DNA analysis
GEDmatch: gedmatch.com
DNAPainter: - dnapainter.com - Shared cM and WATO Tools
Science the Heck Out of Your DNA by Dr. Leah Larkin. The DNA Geek: Mixing Science and Genealogy at thednageek.com
Blaine T. Bettinger. Blaine T., The Family Tree Guide to DNA Testing and Genetic Genealogy, Penguin Random House LLC, Copyright 2016 and 2019. ISBN 978-1-44030-057-8
Vance, David, The Genealogist’s Guide to Y-DNA Testing for Genetic Genealogy, Copyright 2020. ISBN: 9798621504779
Some additional commentary
by Maurice Gleeson (Sep 18th)
Georgian's article has attracted quite a lot of positive comment in various Facebook groups including the the Genetic Genealogy Tips & Techniques group and the DNA Painter: WATO users group.
An interesting point was raised about the pivotal role of the 4th cousin once removed relationship (4C1R) in the analysis of Scenario B. The 105 cMs shared between JR and FT was deemed to be a "not possible" relationship (Probability = 0.00%), using WATO version 1 for the analysis. Thus Scenario B fell down and and was accordingly ruled out.
 |
| Extract from the final Table in the article above - WATO v1 deems 105 cM to be incompatible with a 4C1R relationship |
However, it was pointed out in the discussion on Facebook that 105 cM has been observed in 4C1R relationships. So why was a 4C1R relationship ruled out as impossible by WATO?
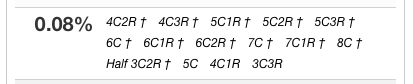
The upper limit of shared DNA for a 4C1R relationship varies depending on which reference you consult. For example, the range in the Shared cM Relationship Chart for 4C1R is 0-126cM but in WATO (v1) the upper range appears to be 98cM (probability 0.08%) because 99cM generates a 0.00% probability. And with WATO (v2) the range is 0-114cM, as 115cM generates a score of 0.00% probability. So, to summarise, the ranges for the various tools are as follows:
- WATO version 1 ... 0 - 98 cM
- WATO version 2 ... 0 - 114 cM
- Shared cM Relationship Chart ... 0 - 126 cM
Why are these ranges different? and (more importantly) does it matter? does it have a significant impact on the outcome to the analysis described in the article? The short answer is no, probably not ... and I'll deal with this first.
 |
| The Shared cM Relationship Chart |
 |
| 98 cM is the upper limit associated with WATO version 1 |
 | |
|
 | |
|
 |
| Only 0.7% of reported 4C1R relationships share 105 cM or greater |
Furthermore, putting each of these values into the Shared cM Tool generates probabilities for a 4C1R no greater than 0.08%, meaning that the chances of it being some other relationship are 99.02% or greater.
 |
| The probability that 98 cM is associated with a 4C1R is no greater than 0.08% |
So, in relation to the case explored in the article, the chances of the connection between JR and FT being a 4C1R appears to be less than 1%.
Even if we used WATO version 2 to compare JR and FT, the probability for a 4C1R relationship (Scenario B) would be 0.5% and a 3C1R relationship (Scenario A) would be 4%, making Scenario A eight times more likely than Scenario B (i.e. 4 / 0.5 = 8). And because we have ruled out all other permutations of the connections between the 5 families, Scenario B remains the most logical explanation.
 |
| Scenario A in WATO v2 ... JR & FT are 3C1R |
 |
| Scenario B in WATO v2 ... JR & FT are 4C1R |
So, even though a value of 105 cM has been observed for some 4C1R relationships, it is the least likely of the two Scenarios considered and therefore this does not substantially influence the conclusions of the exercise - that the 5 family groups are more likely to be siblings than any other relationship.
The only caveat is the possibility of a second connection. What is the likelihood that more than one connection is present between the two people compared? and thus the amount of DNA they share represents more than one connection in common?
Even if we allowed for more than one connection, and reduced the amount shared from 105 cM to say 65cM, the Odds Ratio would still favour Scenario A over Scenario B, making the former 16 times more likely (i.e. 16% vs 1%).


And even if we drop it to 30 cM, Scenario A would be 3 times more likely than Scenario B.


So, despite these limitations, Scenario A remains the most logical conclusion.
Of course, it would be nice if the conclusions did not hinge on a single comparison (i.e. that between JR & FT). Having 2 or more relationships turning red for a particular Scenario would increase our confidence that we could confidently rule it out. But we can only use the data that is in front of us. Still, we can always attempt to collect more data and try to bolster our conclusions with an expanded dataset.
This discussion raises some additional interesting questions which I would love to explore further at some stage, but for now I will simply raise them as points of interest and park them for discussion at some future date:
- Has the risk of second (or more) connections been quantified?
- For example, how many people with a 4C1R relationship have a second connection? or a third connection? etc
- And by what amount of cMs (on average, and the range) does this inflate the amount of DNA shared?
- Can a correction factor be applied to any WATO calculations?
- What is the acceptable Genealogical Proof Standard for WATO?
- 99% probability?
- 98% probability?
- 95% probability?
- something else?
Let's turn now to why the three tools are associated with different ranges, as this may influence the confidence we have in the results.
The first point to note is that different approaches were used to generate the different ranges on all three tools (Shared cM Relationship Chart, WATO v1, & WATO v2). The ranges in the Shared cM Relationship Chart (and the frequency distribution histograms) are derived from Blaine Bettinger's Shared cM Project (SCP), which is based on crowd-sourced, self-reported data, whereas the ranges in WATO are based on simulated data. Both approaches have their advantages and their limitations.
 |
| Ranges vary on the three tools |
In his explanatory notes, Blaine describes how the ranges for version 4 of the SCP were derived. The amounts for each relationship were based on "Real World" data reported by people filling out the SCP submission form. In total, 59,714 submissions were made and there was an obvious error in 2.9% of these (1,739) so these erroneous submissions were removed from the analysis. A further 1% of the submissions for each relationship were then removed, 0.5% from the upper end of the range and 0.5% from the lower end of the range. This removed the extreme outliers for each relationship. So the range for each relationship represents only 99% of the "cleaned" self-reported data for that particular relationship. The values in both the Shared cM Relationship Chart and the frequency distribution histograms are based on this data.
Why remove the extreme outliers? Because in many cases these will be incorrect. The reasons for this include:- a mistake was made in entering the data (e.g. instead of 130, 230 was inputted)
- the reported relationship was incorrect (e.g. due to an error in the genealogical research, or a hidden NPE or DNA switch)
- the relationship was only submitted if there was a substantial amount of DNA shared
- some people had hidden double- or triple-connections in their family trees (i.e. Pedigree Collapse)
The last factor could be particularly relevant, especially when dealing with Irish family trees, most lines of which do not get past the 1800 timepoint. So, for example, someone may identify a relationship to another person as being a 4C1R (based on documentary data) and may assume that the amount of DNA they share is solely due to this relationship. But, unknown to them, they may also be 5th cousins (for example) on a different ancestral line, and 6th cousins on a third ancestral line. These connections are hidden because all the lines on their family tree stop at 1800 due to the absence of Irish records. But the amount of DNA contributed by the 5th and 6th cousin connections could be 20 cM and 15 cM respectively, inflating the total amount of DNA shared by 35 cM. And if the actual amount of DNA contributed by the 4C1R connection was only 30 cM, the total amount shared would be inflated to 65 cM by the two additional hidden relationships. Thus the amount of DNA shared for a 4C1R relationship would be falsely reported to be 65cM instead of 30cM.
So it is quite likely that a significant number of higher values reported for a given relationship were due to hidden second and third (or more) connections between the two people compared - hence the rationale for removing the extreme outliers. But does this "correction" compensate sufficiently? Possibly not. And thus the upper end of the range for some relationships, especially the more distant ones, may be falsely inflated and not an accurate reflection of reality.
And this uncertainty drives the need for a different and complementary approach ... simulated data.
Both versions of WATO use simulated data to derive the range for any given relationship. In addition, the probabilities generated by the Shared cM Tool uses simulated data. This simulated data is sourced from a project undertaken by AncestryDNA and published in their Matching White Paper (from July 2020). Leah explains more about this in her article here.
In contrast, the self-reported data from the Shared cM Project is used in the Shared cM Relationship Chart and the frequency distribution histograms.
The advantage of simulated data is that you can control exactly what you put into a computer programme and thus you can have more confidence in the outputs ... in theory. The big limitation is that if you use the wrong model, you will get the wrong results. And another problem is that Ancestry have never published how they generated the simulated data, so their approach cannot be assessed by an independent third party for any flaws or errors.
However, Leah Larkin has been able to generate simulated data for a 4C1R relationship using the Ped-sim software and compare it to the self-reported data used in the frequency distribution histograms. Leah has shared some hugely informative analyses and graphs in the following thread in the DNA Painter: WATO users group on Facebook. The most relevant finding, for the purposes of the current discussion, is the over-representation of higher cM values. There may be several factors causing this over-representation and these may include:
- there is a relative under-reporting of low values and over-reporting of higher values
- many of the higher values are due to more than one ancestral connection between the two people being compared
Maybe there is a way of simulating this, for a variety of different scenarios (such as population size, the extent of endogamy or pedigree collapse within the population, etc)?
Nevertheless, this highlights the flaws associated with the self-reported data. And thus we have to be extra cautious when dealing with high amounts of shared DNA for more distant relationships.
In addition, any conclusions should be based on the totality of the evidence and not simply on a Multiple WATO Analysis alone. In the current example, the evidence used to support a probable sibling relationship among the 5 family groups includes:
- their O'Malley "heads of family" were all born around the same time (within a 14-year period)
- some O'Malley heads of family were born in the same general area of Ireland
- some O'Malley heads of family shared the same profession (stone masons)
- Y-DNA evidence (GD 4 / 111) of a connection between Line 1 (Edward 1819) and Line 2 (John 1825)
- genealogical evidence that the heads of family of Lines 3, 4, and 5 are siblings
- overlapping segments
- between Lines 1 & 2 on Chromosome 7
- between lines 2 and 4 on Chromosome 7, 10 & 16
- Multiple WATO Analyses ruled out all possible relationships other than Scenario A - that all 5 heads of family were siblings
The following articles give some additional information on the topics discussed above:
- Blaine Bettinger's explanatory notes for the Shared cM Project
- Jonny Perl's article introducing the updated Shared cM Tool
- Leah Larkin's article discussing the Shared cM Tool and the simulated data it uses
- Leah Larkin's article discussing the Ped-sim programme and the limitations of simulated data


