The O'Malley DNA Project has a variety of different genetic groups and in Part 1 of this update, we turned our focus to Group 3 and discussed how in fact it is subdivided into several distinct subgroups, all of them belonging to the branch of the Tree of Mankind characterised by the SNP marker M222. This particular SNP marker is especially widespread in Ireland and is associated with Niall of the Nine Hostages. It is also known to be plagued by a phenomenon known as Convergence which results in a lot of people matching each other just by chance.
In the previous post, we looked at all the subgroups in Group 3 except for the largest one. And now we come to that - Group 3a.
 |
| The 6 subgroups in Group 3 are unrelated within the last 1000 years (Dates in black are from YFULL & dates in blue are calculated from FTDNA's Big Y Block Tree allowing 100 years per SNP) |
Description of Group 3a
We finally come to the largest group within the project. And the big question here is: does this group represent the O'Malley's of Murrisk & Burrishoole in Mayo? And consequently, are these group members related to Grace O'Malley (1530-1603)?
Let's look at some of the characteristics of the group:
- Variants include: Maley 1, Malley 2, Melia 2, O'Malley 12, O'Mally 1
- MDKA birth locations include: Mayo 8, Raphoe 1, Dundalk 1, Liverpool 1, Middlesex 1
- The most extensive pedigrees go back to 1756 (Raphoe) and 1770 (probably Mayo)
Four of the 20 members have done the Big Y test and a further 2 have done the M222 SNP Pack. The SNP Progression for this group is as follows:
- M222 > Z46375 > DF106 > DF104 > DF105 > BY35730 > BY35759/60/61
Note that two of the project members have non-Malley surnames (Hodges & Beeler) but identify an O'Malley as their MDKA (Most Distant Known Ancestor). These are examples of a Surname or DNA Switch (SDS, also known as an NPE = Non-Paternal Event or Not the Parent Expected).


Have they been grouped correctly?
Before any analysis can be done, we must ask: have they been grouped correctly? Because if they haven't, then any analysis is likely to be misleading. If everyone in the group had done the Big Y test, and thus we had data on each member's Terminal SNP, then it would be very easy to say whether the grouping was correct or not. The Terminal SNP data would tell us whether all group members were on the same "downstream" branch of the Tree of Mankind (i.e. correctly grouped) or on different branches (i.e. incorrectly grouped).
But in the absence of SNP data for all 20 members, there are several questions we can ask to help ascertain the likelihood that the group members have been correctly grouped together:
- How closely related is each group member to every other group member?
- Is there any evidence of Chance Matches? (this increases the risk of inaccurate grouping)
- What is the spread of Genetic Distance (GD) values within the group? (this helps assess the risk of overlap with the STR signatures of neighbouring branches)
Let's look at each of these three questions in turn.
1) How closely related is each group member to every other group member?
As people join any DNA Project, the Administrator assesses who else they match in the project, and assigns each new Y-DNA member to a particular genetic group that already exists, or creates a new group for him, or leaves him in the Ungrouped section. There are various criteria for grouping people together, but the most commonly used criteria would be a) they have the same/similar surname, and b) their Genetic Distance (GD) is within the matching threshold (i.e. 0-4/37, 0-7/67, and 0-10/111). If these two criteria are fulfilled, then we can be reasonably confident that they share a common ancestor within the last 1000 years or so, and thus can be correctly grouped together.
But with every general rule, there is an exception (or ten). And one of the biggest exceptions is: except where there is Convergence present. [1] Because this is going to increase the risk of Chance Matches. And that is going to increase the risk of inaccurate grouping.
And Convergence is a well-known problem with anyone who is M222+.
And all the people in the various subgroups of Group 3 are M222+.
And so we have a problem - the usual rules may not apply.
Hence the need to assess this risk by asking the 3 questions above.
Which brings us to the first question: How closely related is each group member to every other group member?
The SAPP Tool is a great invention. First we upload all the STR marker values for an entire group, then we push a button, and it gives us a matrix of all the Genetic Distance values, as well as a "best fit" family tree for the entire group (more on that later).
The matrix of Genetic Distance values is below. The yellow ID numbers relate to the same numbers in the screenshot of the entire subgroup above. I have indicated the 4 people who have done the Big Y test with a green arrow. We know these 4 people all fall on the same "downstream" branch of the Tree of Mankind (namely DF105 > BY35730) and therefore these 4 Big Y results help us anchor the entire group. Consequently, we can be reasonably confident that anyone who is a very close STR match to these 4 Big Y testers is more likely than not to belong in this group.
For the sake of this exercise, I am arbitrarily defining a "very close STR match" as anyone who has a GD to any of the 4 Big Y testers of 0-2/37, 0-4/67, and 0-5/111 (i.e. about half the usual threshold value of 4, 7, and 10 respectively). Let's call this Conservative Matching and the other Usual Matching. If we compare every group member against these 4 Big Y testers ...
The matrix of Genetic Distance values is below. The yellow ID numbers relate to the same numbers in the screenshot of the entire subgroup above. I have indicated the 4 people who have done the Big Y test with a green arrow. We know these 4 people all fall on the same "downstream" branch of the Tree of Mankind (namely DF105 > BY35730) and therefore these 4 Big Y results help us anchor the entire group. Consequently, we can be reasonably confident that anyone who is a very close STR match to these 4 Big Y testers is more likely than not to belong in this group.
 |
| A matrix of GD values for all members of Group 3a - generated by Dave Vance's SAPP Tool Key: Number of STR markers tested is indicated by blue numbers along the diagonal Green squares = GD at 37 markers, Brown = GD at 67, White = GD at 111 Green arrows = people who have done Big Y test Coloured dots (left) represent risk of being inaccurately grouped ... (red = high, orange = medium, green = low) |
- 6 of the 20 members fall within this threshold and can be considered at low risk of being inaccurately grouped (indicated by the green dots on the left)
- 7 of the 20 fall outside the "very close" threshold but within the usual threshold (i.e. they will have GDs of 3-4/37, 5-7/67, or 6-10/111; they are indicated by orange dots and can be considered medium risk)
- and 3 of the 20 (red dots) fall outside the usual threshold for matching (their minimum GD to any of the Big Y testers is 7/37, 8/67 and 5/37 respectively). These latter 3 group members are at high risk of being inaccurately grouped (making them ideal candidates for the Big Y test).
Let's broaden our comparison. Let's now compare all members against all the other members (and not just against the Big Y members). The number of matches that each member has within the group is indicated in the column of numbers to the right of the matrix above. The maximum number of people that anyone in this group of 20 can match is 19. I have arbitrarily assigned the colour green for more than 10 matches, orange for 5-9 matches, and red for 4 or less (roughly corresponding to the degree of risk of inaccurate grouping). This exercise indicates that two people match each other only and no one else in the group (i.e. two of the three high risk people already identified in the previous comparison). Again, this suggests they are at high risk of being incorrectly grouped here and ideally they should both do the Big Y test (3a16 & 3a17 a.k.a. FOM-7270 and MOM-6438). If the test confirms that they do belong to this group, this has important implications for dating the age of the group.
The other group members who would most benefit from a Big Y test are those who score a "double-orange" (i.e. red or orange dot on the left, orange number on the right) and these include the following (with their initials & last 4 numbers of their corresponding kit numbers):
- 3a18 ... WCM-4285
- 3a19 ... MOM-2779
- 3a26 ... WGB-5552
- 3a27 ... KCOM-3676
- 3a30 ... LOM-5222
- 3a32 ... HCOM-6483
So this analysis shows that two group members are very distantly related to the rest of the group, and an additional 6 members in particular should have their membership of the group confirmed by Big Y testing.
2) Is there any evidence of Chance Matches?
Yes, there is. If we simply examine the number of matches that each member has, it is clear that some group members probably have a high percentage of Chance Matches and others don't. This is illustrated nicely in the table below. The highest number of matches observed is 1476 at the 37 marker level of comparison, 665 at 67 markers, and 19 at 111 markers.
Interestingly, there are several people within the group who have very few matches and therefore do not appear to be at the same high risk of having Chance Matches (members 3a16 & 3a17, but also perhaps 3a18 and 3a25).
 |
| Risk of Chance Matches increases with number of matches in each member's Match List |
Repeating a similar analysis to that carried out for member RLM-7064 in Group 3b (see Footnote 3 in previous post), member 3a29 (DOM-9131) has about 80% Chance Matches at the 111 marker level of comparison, and at least 67% Chance Matches at the 67 marker level (although it is more likely to be closer to 90%). As in the previous analysis, most of these Chance Matches have a Genetic Distance at the upper end of the usual threshold for matching (i.e. 3-4/37, 5-7/67, 6-10/111).
Looking closer at the 67-marker matches for Big Y test-taker 3a29 (DOM-9131) reveals that most of his "Malley or variant" matches occur at lower GD levels and his "non-Malley matches" occur at higher GD levels. This is summarised in the Table below for all his matches at the 67-marker level (n=254) and his SNP-tested matches only (n=66). This shows that any "Malley or variant" matches with a GD of 0/67 to 4/67 are likely to be true matches, but at higher GD levels the proportion of Likely Chance Matches increases, being 83-85% at GD 5/67, 87-97% at GD 6/67 and being close to 100% at GD 7/67.
 |
| 67-marker Matches for 3a29 (DOM-9131) shows likelihood of Chance Matches increases with GD |
Consequently, this high risk of Chance Matches increases the risk of inaccurate grouping (even when the surname appears similar).
3) What is the spread of Genetic Distance (GD) values within the group?
Assessing this allows us to get some idea of how old the group is likely to be, but also it helps add to our understanding of the risk that the STR signatures for the group might overlap with the STR signatures of people on neighbouring branches of the Tree of Mankind.
Looking at the highest Genetic Distance among all 20 group members, the highest value is 10 at the 37-marker level of comparison (i.e. GD 10/37), 12 at 67 makers (12/67), and 20 at 111 markers (20/111). Expressing the GD as a percentage of the number of markers compared gives us equivalent values of 27%, 18% and 17% respectively. (Bear in mind that an exact match would be 0%, and a match at the threshold for declaring a match [4/37, 7/67, 10/111] would be 11%, 10% and 9% respectively.)
If we just focus on the GD between Big Y-tested members (whom we know are all on the same branch and definitely belong in the group), we get the following maximum GD values between member 3a14 vs other Big Y test-takers (using the GD Tool in the GAP pages that I have access to as Admin).
If we just focus on the GD between Big Y-tested members (whom we know are all on the same branch and definitely belong in the group), we get the following maximum GD values between member 3a14 vs other Big Y test-takers (using the GD Tool in the GAP pages that I have access to as Admin).
 |
| Genetic Distance among Big Y test-takers (Note: 3a24 has not tested beyond 37 markers) |
The highest GD is 19/111 which indicates quite a spread in GD values. This is well beyond the level of Conservative Matching (GD 0-2/37, 0-4/67, 0-5/111) and beyond the threshold for Usual Matching (GD up to 4/37, 7/67, 10/111). In fact, it suggests that some group members' STR signatures are highly likely to encroach on those of neighbouring branches. And this simply serves to emphasise that the risk of Chance Matches among members of this group is high.
Interestingly, the distance of the relationship between 3a14 and 3a25 only becomes apparent at the 111 marker level of comparison. At lower levels of comparison, the distance does not look that great. This is more apparent if we express the GD as a percentage of the number of markers compared - 11% (4/37), 12% (8/67) and 17% (19/111). This just goes to show that testing to 111 markers can provide a more granular assessment with a more informative level of fine detail.
Summary
So at the end of this analysis, we can say that there are varying levels of confidence in regard to whether or not each member of the group has been grouped correctly:
- For some we are 100% confident they belong in the group - this applies to the 4 Big Y test-takers.
- Next, we might have perhaps a 90% level of confidence that all the "green dot" members belong to the group. These are all very close matches to the Big Y test-takers (using the Conservative Matching approach - 10 members)
- For others, our level of confidence maybe falls to 75% - the "orange dot only" members (2 people)
- For others, it falls to 60% - the "double-orange" members (6 people)
- And for yet others, it falls to maybe 40% or less - the "red dot" members (2 people)
This uncertainty has consequences when we come to analysing the group and addressing questions such as how old is the group and where did it come from. Any conclusions need to be cautious as they may be subject to change once new data (esp. Big Y data) becomes available.
What are the origins of the group?
There are various ways of assessing this:
- MDKA birth locations
- analysing surnames of group members' matches (via distribution maps & surname dictionaries)
- and extensive pedigrees
Of the 20 group members, 8 state Mayo as a probable/possible origin of their MDKA (Most Distant Known Ancestor). Not all group members have entered this data and it would be really helpful if they did.
The second method of assessing likely origins is to look at the surnames of the members' matches (both SNP-related matches & STR-related matches) and then conduct a Surname Distribution Map exercise [2] and look up Surname Dictionaries [3] to see if this reveals a probable place of origin. We did this for many of the subgroups discussed in the previous post. Matches' surnames can be harvested from several sources:
- The Big Tree
- FTDNA's Big Y Block Tree
- Haplogroup (& other) Projects
- and each group member's STR-related list of matches
And here we run into problems. The Group 3a O'Malley's sit on branch BY35730 of the Tree of Mankind. The branch immediately upstream is DF105 (and it is at least 1850 years old). Usually there may be 4 or 5 or 6 branches adjacent to any other branch, but in our case there are 456 neighbouring branches (below DF105)! This makes harvesting genetically-related surnames from these adjacent branches a herculean task and raises serious concerns as to its possible value.
Eyeballing the surnames on the 456 adjacent branches (which you can see here on the Big Tree) reveals the majority have Irish origins but quite a few have Scottish & English origins too.
A similar problem is encountered when trying to harvest genetically-related surnames from the M222 Haplogroup Project. There are simply too many adjacent branches and no way of knowing which is more relevant than the other.
So that leaves us with the surnames of each member's STR-related matches. We can try to control for Chance Matches by using a Conservative Threshold (2/37, 4/67, 5/111) rather than the Usual Threshold (4/37, 7/67, 10/111). This gives us the list in the table below. Some group members have many matches with a GD of 2/37 (90 in once case) so it may be that this particular threshold is not conservative enough and a GD threshold of 1/37 would be more appropriate.
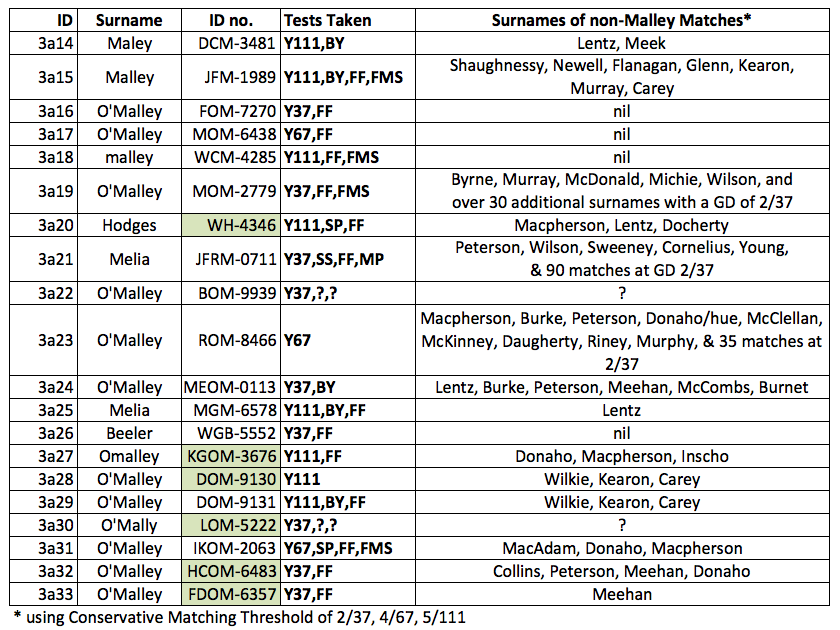 |
| List of surnames of group members' STR-matches using Conservative Matching Threshold |
This exercise generated a list of 32 unique surnames. At least 3 of them (Carey, Wilson, Inscho) do not sit on branches below DF105 and therefore are not related to the Group 3a O'Malley's for at least 1850 years. I used the surname distribution maps on Shane Wilson's website to explore where these names most commonly occurred.
- Some have strong associations with the Mayo/Galway area: Burke, Burnet, Flanagan, Newell, Shaughnessy
- Others with Donegal: Docherty, Meehan, Sweeney, Wilkie
- And quite a few have a probable Scots-Irish origin: Glenn, MacAdam, Macpherson, McClellan, McDonald, McKinney, Wilson, Young
So no clear conclusions can be drawn about the origins of Group 3a based on the surnames of genetically-related matches.
So that leaves the third method (extensive pedigrees) as a means to establishing the origins of the group. And for that we will need to identify extensive pedigrees going back into the 1600s, before the major land grab that followed Cromwell's conquest of Ireland in the mid-1600s. We don't have any such extensive pedigrees at the moment but there are ways that we can target people with such pedigrees and ask them to test and join the project. And that will be the topic of a subsequent post.
Summary
How old is the group?
There are several ways of assessing how long the group have been carrying their particular genetic signature:
- MDKA birth information
- TiP Report tool (using the group's maximum GD values)
- SNP dating
- Dave Vance's SAPP Tool
The MDKA information currently provided shows that the earliest pedigrees go back to 1756 and 1770, suggesting that the group may have carried their genetic signature since the late-1700s at least.
The TiP Report tool generates the following TMRCA estimates based on the largest GDs within the entire group (TMRCA, Time to Most Recent Common Ancestor). The midpoint estimate is the 50% level, and I have included 5% and 95% levels to give a better idea of how broad the range is around each midpoint estimate (note that 24 is the highest number of generations the calculator can go). The midpoint estimate is primarily around the 1440 timepoint, with a range of pre-1230 up to 1710. You can see from this how crude the calculation is.
 |
| TMRCA Estimates for the most distantly related members of Group 3a (the top table gives the TMRCA in generations, and the bottom table converts it to a crude year, allowing 30 years per generation) |
SNP dating (allowing 100 years per SNP) suggests that the branch BY35730 (which is almost exclusively O'Malley's - there is a single Donaho in there too) was formed at least 1250 years ago (if not much earlier). This is calculated as indicated below. Please bear in mind these estimates are very crude indeed.
- BY35730 is a 7-SNP block (representing about 700 years)
- the branch below that is a 3-SNP block (representing about 300 years) but for some reason The Big Tree does not show BY35759 in this block, but FTDNA's Big Y Block Tree does.
- the blue numbers below indicate the number of unique / "private" SNPs discovered for each of the 4 Big Y test-takers
- the Most Recent Common Ancestor (MRCA) for the branch on the left can be calculated thus: (4+6+4) / 3 = 4.7 = 470 years ago (i.e. about 1500 AD)
- the TMRCA for the left & right branch is about 535 years ago, calculated thus: 470 + 300 on the left, 300 on the right, average for the 2 branches is (770+300)/2 = 535 years ago. This equates to about 1400 AD and suggests that Group 3a have carried this DNA signature for at least the last 600 years or so.
- the TMRCA for the next branch up (DF105) is about 535 + 700 = 1235 years ago, based on the data below, but when taking into account the data from all 456 branches below DF105, YFULL estimates that this branch is at least 1850 years old.
 |
| The position of Group 3a on the Tree of Mankind (from The Big Tree) The blue numbers indicate the number of Unique / Private SNPs |
And lastly, the 'best fit" family tree generated by the SAPP Tool suggests that the common ancestor for the entire group was born about 1400 AD (but within a very broad range of 1000 to 1750). The accuracy of these estimates would be improved if everyone in Group 3a upgraded to 111 STR markers (i.e. Y-DNA-111) or the Big Y-700 (which covers up to 700 STR markers). More information on this Mutation History Tree is included in the footnotes. [4]
 |
| The Mutation History Tree for O'Malley Group 3a (generated by the SAPP Tool) Black numbers refer to the ID numbers but without 3a in front of them. Red numbers refer to the estimated date of each branching point. |
Summary
So based on all the above data, the best guess is this group has been carrying their DNA signature for at least 600 years (1400 AD approximately). That leaves about 400 years unaccounted for, back to the foundation of surnames about 1000 AD. What happened during those 400 years is anybody's guess. Was the O'Malley surname of Group 3a associated with the same particular DNA back to the time that the surname was founded? or was there an SDS (Surname or DNA Switch) somewhere along the way, and the O'Malley surname was previously associated with a different DNA signature? We simply don't know at this stage. But we can calculate the probability that an SDS occurred, and that probability is 13-24%. [5] Which means the probability of no SDS is quite high (i.e. 76-87%).
Is there a link to an Irish Clan?
Which brings us to the last question: can we link Group 3a to Grace O'Malley? does the DNA signature of Group 3a represent the Y-DNA signature of Grace O'Malley's male forebears?
Well, although the TMRCA estimates for the group are tentative, they do nevertheless bring us back to the time of Grace O'Malley (1530-1603) and this is encouraging news. There are two possible ways in which we can establish a link to Grace.
- Firstly, if we can find extensive pedigrees that can be linked to Grace, then it may be possible to test living male descendants of her brother or uncle (or other male relatives). If they share the same Y-DNA signature as Group 3a, then this is very strong evidence that we have identified the Y-DNA signature of Grace's clan.
- The second approach involves searching the ancient pedigree of Grace's O'Malley clan and identifying the associated surnames. If the Y-DNA signature of Group 3a is that of Grace O'Malley's clan, then there should be a higher incidence of the signature among the supposedly genealogically-related surnames. There are several sources that can be used to obtain the ancient pedigree [3] and a similar approach was taken to identify the Y-DNA signature of the Dal gCais (Doll Gosh) and it's most famous son Brian Boru. [6]
The strategy for this next stage of the project will be discussed in a separate post.
Conclusions & Next Steps
Conclusions & Next Steps
The predominant surname among Group 3a is O'Malley. The MDKA of many group members (8 of 20) goes back to Mayo. This group has carried its associated DNA signature since about 1400 AD.
All group members should join the M222 Haplogroup Project. Just click this link and sign in to your FTDNA account.
In addition, all group members should join the Ireland Y-DNA Project (click here to join).
The Admins in these projects may provide some additional insights and advice on further SNP testing. I am frequently in touch with these Admins about project-related matters.
All members should supply a birth location for their MDKA - see item 2 on this page for full instructions.
All members should supply pedigree information about their direct male line - full instructions are on the Post your Pedigree page.
Going forward, there will be a concerted effort to identify and test people with extensive pedigrees. We need more recruits for this purpose and project members are encouraged to find and engage such people. I am very happy to help with this as required.
Additional analysis will be undertaken to assess if surnames that are supposedly genealogically-related to Grace O'Malley's direct male line share the same Y-DNA signature as Group 3a. This will follow a similar approach to that successfully used to identify the Y-DNA signature of the Dal gCais & Brian Boru.
Maurice Gleeson
July 2019
Footnotes & Sources
[2] Surname Distribution Maps for Ireland can be found on several websites:
- John Grenham's website (www.johngrenham.com) has maps based on Griffith's Valuation (from the mid-1800s). The first 5 searches are free and then you need to take out a subscription.
- Shane Wilson's website also uses Griffith's Valuation (https://www.swilson.info/sdist.php). No subscription needed.
- Barry Griffin's website has maps based on the 1901 & 1911 censuses, including maps identifying just the farmers (whose families are likely to have held the land for several generations at least).
- I used to use the PublicProfiler websites (WorldNames & GBNames) but these no longer seem to be maintained.
- I also used to use the forbears.co.uk but the new format provides less fine detail than previously.
[3] There are several Surname Dictionaries that provide Irish surname histories and the most useful are:
[4] Because we have quite a few members in this particular group, we can build a Mutation History Tree (MHT) from the available pedigrees and the STR & SNP mutations (hence the name, Mutation History Tree). This can be done visually or by using Dave Vance's SAPP Programme. I've done this for my Gleeson Lineage II and you can see a video about it here (from the FTDNA Annual Conference in 2017).
- Woulfe, Patrick. Sloinnte Gaedheal is Gall: Irish Names and Surnames, collected and edited with explanatory and historical notes (1923). ... available at https://www.libraryireland.com/names/contents.php
- O'Hart, John. Irish pedigrees; or, The origin and stem of the Irish nation (1892, 5th edition) ... available at https://www.libraryireland.com/Pedigrees1/title.php
- MacLysaght, Edward. Several books but unfortunately not available online:
The Surnames of Ireland. 1957 (sixth edition 1991)
Irish Families. Their Names, Arms and Origins. 1957 (fourth edition 1985)
More Irish Families. 1970 (first paperback edition 1996, incorporating Supplement to Irish Families, 1964)
[4] Because we have quite a few members in this particular group, we can build a Mutation History Tree (MHT) from the available pedigrees and the STR & SNP mutations (hence the name, Mutation History Tree). This can be done visually or by using Dave Vance's SAPP Programme. I've done this for my Gleeson Lineage II and you can see a video about it here (from the FTDNA Annual Conference in 2017).
In effect, the tree is using genealogical data back to the time of the MDKA and thereafter is using DNA mutations to define the connectedness between different branches. This generates a branching structure based on mutations and thus a "best fit" family tree for the entire group of 20 people. As more data becomes available, the "best fit" may adapt and change. So it merely represents the "group family tree" that is closest to what we currently can estimate given the available genealogical and DNA data. The optimal "best fit" would be achieved by all group members doing the Big Y-700 test - this would define all the SNP markers shared among the group members, as well as any mutations in their c.700 STR markers.
The advantage of the MHT is that it identifies specific sub-branches within the overall group and helps identify who is more closely related to whom. This in turn helps with genealogical enquiries and collaboration between group members.
[5] the risk of an SDS (Surname or DNA Switch) is calculated thus:
- 400 years represents approximately 13.3 generations (allowing 30 years per generation)
- The rate of SDS's is about 1-2% per generation (based on several published studies)
- The probability of having no SDS's in 13.3 generations given a 1% SDS probability per generation is 0.99^13.3 = 0.8749 (87%). So the probability of having at least one SDS is 1 - 0.8749, that is 13%.
- The probability of having no SDS's in 22 generations given a 2% SDS probability per generation is 0.98^13.3 = 0.7644 (76%). So the probability of having at least one SDS is 1 - 0.7644, that is 24%.
- So there is a 13% to 24% chance that there was a switch in the surname or the DNA for Group 3a during the 400 year period between the foundation of surnames (1000 AD) and the MRCA for the group (born about 1400 AD approximately).
[6] Dennis M Wright, 2009. A Set of Distinctive Marker Values defines a Y-STR Signature for Gaelic Dalcassian families. Journal of Genetic Genealogy, 5(1):1-7. Available at http://www.jogg.info/pages/51/files/Wright.pdf


No comments:
Post a Comment